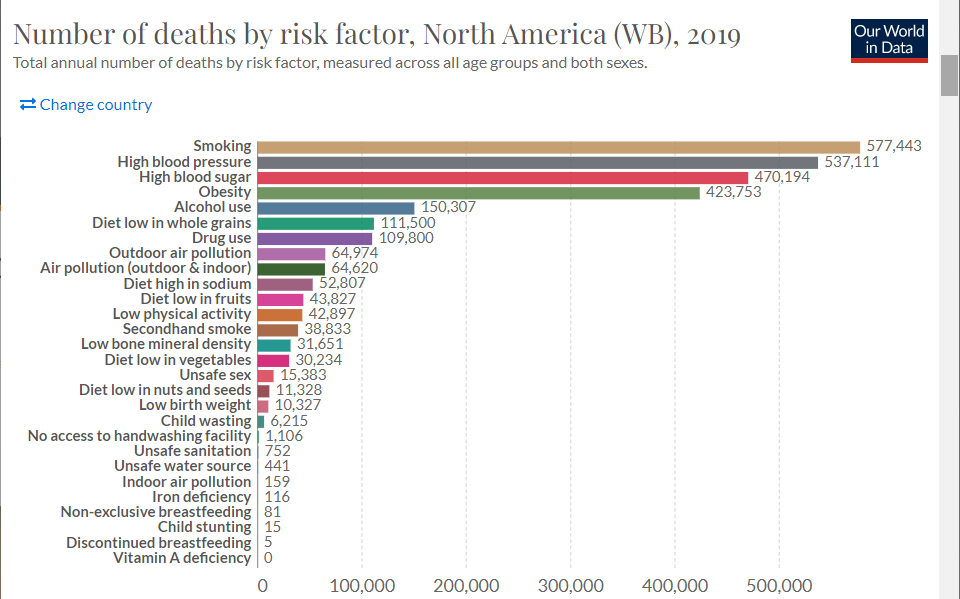
I downloaded number of deaths by risk factor data from Our World in Data because I am interested in what health related risk factors have the most impact on our health.
This is the link to the data.
The following code chunk loads the package I will use to read in and prepare the data for analysis.
- Read the data in
- Use glimpse to see the names and types of the columns
glimpse(annual_deaths_by_risk)
Rows: 6,840
Columns: 31
$ Entity                                                                                                             <chr> ~
$ Code                                                                                                               <chr> ~
$ Year                                                                                                               <dbl> ~
$ `Deaths - Cause: All causes - Risk: Outdoor air pollution - OWID - Sex: Both - Age: All Ages (Number)`             <dbl> ~
$ `Deaths - Cause: All causes - Risk: High systolic blood pressure - Sex: Both - Age: All Ages (Number)`             <dbl> ~
$ `Deaths - Cause: All causes - Risk: Diet high in sodium - Sex: Both - Age: All Ages (Number)`                      <dbl> ~
$ `Deaths - Cause: All causes - Risk: Diet low in whole grains - Sex: Both - Age: All Ages (Number)`                 <dbl> ~
$ `Deaths - Cause: All causes - Risk: Alcohol use - Sex: Both - Age: All Ages (Number)`                              <dbl> ~
$ `Deaths - Cause: All causes - Risk: Diet low in fruits - Sex: Both - Age: All Ages (Number)`                       <dbl> ~
$ `Deaths - Cause: All causes - Risk: Unsafe water source - Sex: Both - Age: All Ages (Number)`                      <dbl> ~
$ `Deaths - Cause: All causes - Risk: Secondhand smoke - Sex: Both - Age: All Ages (Number)`                         <dbl> ~
$ `Deaths - Cause: All causes - Risk: Low birth weight - Sex: Both - Age: All Ages (Number)`                         <dbl> ~
$ `Deaths - Cause: All causes - Risk: Child wasting - Sex: Both - Age: All Ages (Number)`                            <dbl> ~
$ `Deaths - Cause: All causes - Risk: Unsafe sex - Sex: Both - Age: All Ages (Number)`                               <dbl> ~
$ `Deaths - Cause: All causes - Risk: Diet low in nuts and seeds - Sex: Both - Age: All Ages (Number)`               <dbl> ~
$ `Deaths - Cause: All causes - Risk: Household air pollution from solid fuels - Sex: Both - Age: All Ages (Number)` <dbl> ~
$ `Deaths - Cause: All causes - Risk: Diet low in vegetables - Sex: Both - Age: All Ages (Number)`                   <dbl> ~
$ `Deaths - Cause: All causes - Risk: Low physical activity - Sex: Both - Age: All Ages (Number)`                    <dbl> ~
$ `Deaths - Cause: All causes - Risk: Smoking - Sex: Both - Age: All Ages (Number)`                                  <dbl> ~
$ `Deaths - Cause: All causes - Risk: High fasting plasma glucose - Sex: Both - Age: All Ages (Number)`              <dbl> ~
$ `Deaths - Cause: All causes - Risk: Air pollution - Sex: Both - Age: All Ages (Number)`                            <dbl> ~
$ `Deaths - Cause: All causes - Risk: High body-mass index - Sex: Both - Age: All Ages (Number)`                     <dbl> ~
$ `Deaths - Cause: All causes - Risk: Unsafe sanitation - Sex: Both - Age: All Ages (Number)`                        <dbl> ~
$ `Deaths - Cause: All causes - Risk: No access to handwashing facility - Sex: Both - Age: All Ages (Number)`        <dbl> ~
$ `Deaths - Cause: All causes - Risk: Drug use - Sex: Both - Age: All Ages (Number)`                                 <dbl> ~
$ `Deaths - Cause: All causes - Risk: Low bone mineral density - Sex: Both - Age: All Ages (Number)`                 <dbl> ~
$ `Deaths - Cause: All causes - Risk: Vitamin A deficiency - Sex: Both - Age: All Ages (Number)`                     <dbl> ~
$ `Deaths - Cause: All causes - Risk: Child stunting - Sex: Both - Age: All Ages (Number)`                           <dbl> ~
$ `Deaths - Cause: All causes - Risk: Discontinued breastfeeding - Sex: Both - Age: All Ages (Number)`               <dbl> ~
$ `Deaths - Cause: All causes - Risk: Non-exclusive breastfeeding - Sex: Both - Age: All Ages (Number)`              <dbl> ~
$ `Deaths - Cause: All causes - Risk: Iron deficiency - Sex: Both - Age: All Ages (Number)`                          <dbl> ~
#view(annual_deaths_by_risk)
- Use output from glimpse to prepare the data for analysis
- create the object
regionsthat is the list of regions I want to extract from the database - use filter to extract rows that I want to keep
regional_deaths_by_risk <-annual_deaths_by_risk %>%
  rename(Region = 1, Highbloodpressure = 5, highsodium = 6, Lowwholegrain = 7,
         Alcohol = 8, Lowfruit = 9, Lownuts = 15, Lowvegetables = 17, Lowactivity = 18, Smoking = 19, Highbloodsugar = 20, Obesity = 22, Drugs = 25) %>%
  filter(Year== 2019, Region =="North America (WB)") %>%
  select(Region, Year, Highbloodpressure, highsodium, Lowwholegrain, Alcohol, Lowfruit, Lownuts, Lowvegetables, Lowactivity, Smoking, Highbloodsugar, Obesity, Drugs)
- Check that the total deaths for obesity for 2019 are the same
# A tibble: 1 x 1
  total_North_America
                <dbl>
1 423753- Add a picture
 (width = 100%)
write_csv(regional_deaths_by_risk, file = "regional_deaths_by_risk.csv")